Data Visualization
- Sheridan Libraries
- Guides
- Data Visualization
- Designing Effective Data Visualizations
Data Visualization Best Practices
1. Know your audience.
2. Know you message.
3. Adapt your visualization scale to the presentation medium.
4. Avoid chartjunk (Keep it simple).
5. Use color effectively.
6. Avoid the default settings.
Ask Me

Choosing an Appropriate Visual Encoding
Data visualization relies on communication through perception. A good data visualization can exploit the natural tendency of the human visual system to recognize structure and patterns.
The brain can process information faster and more efficiently when it is in a visual format.
Key to achieving this is the choice of visual encodings for your data that correspond to preattentive attributes. Preattentive attributes are visual attributes, including size, color, shape, and position that are processed at a high speed by the visual system.
Consider the images below, what stands out to you in each image? Was the red dot in the color hue figure immediately apparent? That is preattentive processing at work.
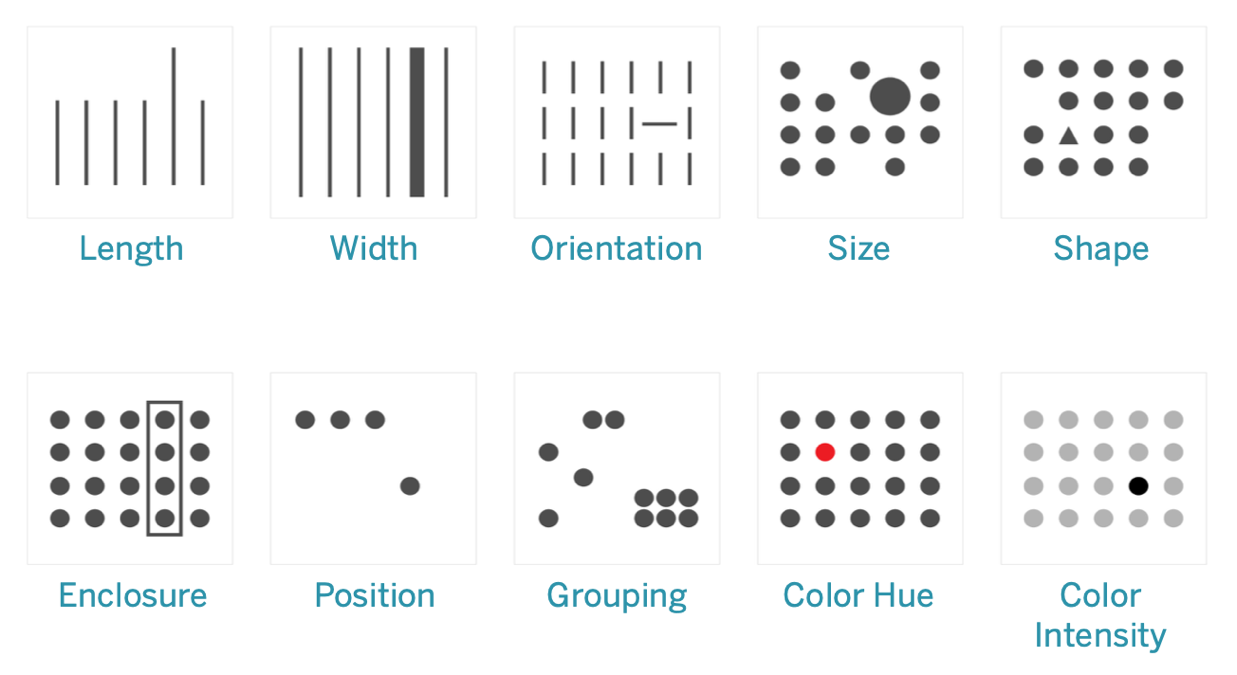
Image Source: https://help.tableau.com/current/blueprint/en-us/bp_why_visual_analytics.htm
| Precision of Quantitative Information | Attribute | Example | Natural Interpretation |
|---|---|---|---|
Highly Precise |
Length |
|
Longer = Greater |
Position |
|
Higher = Greater |
|
Imprecise |
Width |
|
Wider = Greater |
Size |
|
Larger = Greater |
|
Intensity |
|
Darker = Greater |


Images adapted from: https://help.tableau.com/current/blueprint/en-us/bp_why_visual_analytics.htm
Table adapted from: Few, S. (2009). Now you see it: Simple visualization techniques for quantitative analysis (p. 41). Oakland, CA: Analytics Press.
Color in Data Visualizations
Choosing a Color Palette
Your selection of a color palette in your data visualization will depend on properties of your data. The three primary types of color palettes include:
Type of Color Palette |
Description of Use |
Example |
|---|---|---|
Qualitative Palette |
Categorical data that does not have an inherent ordering. |
|
Sequential Palette |
Data that is numeric, or has a natural ordering. |
|
Diverging Palette |
Numeric data that diverges from a center value. |
|


Image Source: https://medium.com/nightingale/how-to-choose-the-colors-for-your-data-visualizations-50b2557fa335
Color in Data Visualization Resources
-
ColorBrewer2
 A tool for generating sequential, diverging, and qualitative color palettes. Originally intended for cartography, this tool can be used for generating color palettes for a range of data visualizations.
Data Visualization Design Resources
-
Data Viz Catalogue
 The Data Visualization Catalogue provides a useful taxonomy of visualizations, organized by functions such as comparisons, proportions, and distributions. It is a good place to start if you are not certain what data visualization is right for you.
 -
Ten Simple Rules for Better FiguresA useful article published in PLOS Computational Biology which compresses data visualization best practices into ten simple rules.
-
Perception in VisualizationA detailed introduction to the role human perception plays in visualization, with a focus on preattentive attributes.