Data Visualization
- Sheridan Libraries
- Guides
- Data Visualization
- Network Visualization
Guide for technologies, techniques, and best practices for data visualization.
Contact Me

Introduction to Network Visualization
A network refers to an object composed of elements and relationships or connections between those elements.
Network analysis is a collection of techniques for examining the relationships between entities, and depicting the structure of those relationships. Network analysis spans a number of domains, including social networks, bibliometrics, epidemiology, bioinformatics, complex systems, and text analysis.
Graph theory provides the formal basis for network analysis, across domains, and provides a common language for describing the structure of networks.
Network visualization involves the visualization of the relationships (edges or links) between data elements (nodes).
Network Visualization Software
- Gephi
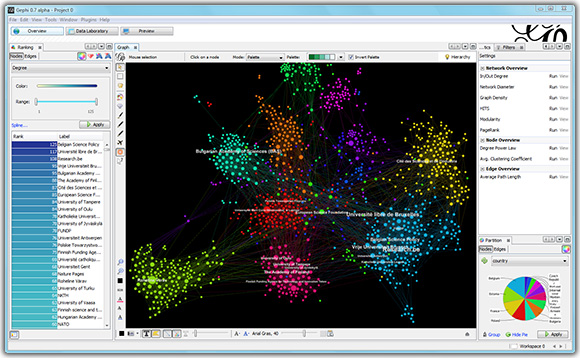 Gephi is the leading visualization and exploration software for all kinds of graphs and networks. Gephi is open-source and free.
 - Cytoscape
 Cytoscape is an open source software platform for visualizing complex networks and integrating these with any type of attribute data.
 - GraphVis
 Graphviz is open source graph visualization software. It has several main graph layout programs. It also has web and interactive graphical interfaces, and auxiliary tools, libraries, and language bindings.
 - igraph
 An open-source collection of network analysis tools with connectors in R, Python, Mathematica and C/C++.
 - UCINET
 UCINET 6 for Windows is a software package for the analysis of social network data. UCINET comes with the NetDraw network visualization tool.
 - SocNetV
 The Social Network Analysis and Visualization Software (SocNetV) is a fee and open-source tool for social network analysis.
 - Pajek
 Analysis and visualization of very large networks on Windows. Pajek is a free alternative to UCINET.
Network Visualization and Analysis Programming Libraries
Programming Language |
Network Visualization and Analysis Library |
|---|---|
Python |
NetworkX is a Python package for the creation, manipulation, and study of the structure, dynamics, and functions of complex networks. |
python-igraph is a Python connector to the igraph collection of network analysis tools. |
|
R |
igraph is an R connector to the igraph collection of network analysis tools. |
visNetwork is an R package for interactive network visualization, built on the vis.js Javascript library. |
|
Julia |
JuliaGraphs is an aggregation of all the common packages in Julia for using and studying graphs, including visualization using the GraphPlot and NetworkLayout packages. |